Home/Case studies/Macrulez REST API
Node.js · ExpressVue 3PostgreSQLEChartsDockerSide project

Admin panel
for a REST API service

I lived by the "if the service is running, it's fine" mindset. Problems surfaced through complaints or via docker logs

7panel sections
54 KBmain JS bundle
3cache layers under control
< 5 minfrom symptom to root cause
The problem

"It's running —
that means
it's fine."

My own Node.js service — a REST API for several projects: a blog, an airline route map, and a couple of others. Inside: PostgreSQL, a two-tier cache (in-memory + on-disk), and an HTTP cache for public responses. All of it runs in Docker on a VPS.

The problem was that I knew nothing: how many keys were currently in the cache, what the hit rate was for a given endpoint, whether heap was growing after a deploy, when the cache started missing. The only way to find out was through docker logs or by writing a one-off script. The user found out about problems before I did — not the other way around.

I wanted something different: a system that would tell me what's happening right now — and let me act on it without restarting the server.
Panel architecture

7 sections,
each solving
its own task.

Not a single "stats screen," but a set of specialized tools — each with its own question and its own audience.

01

Dashboard

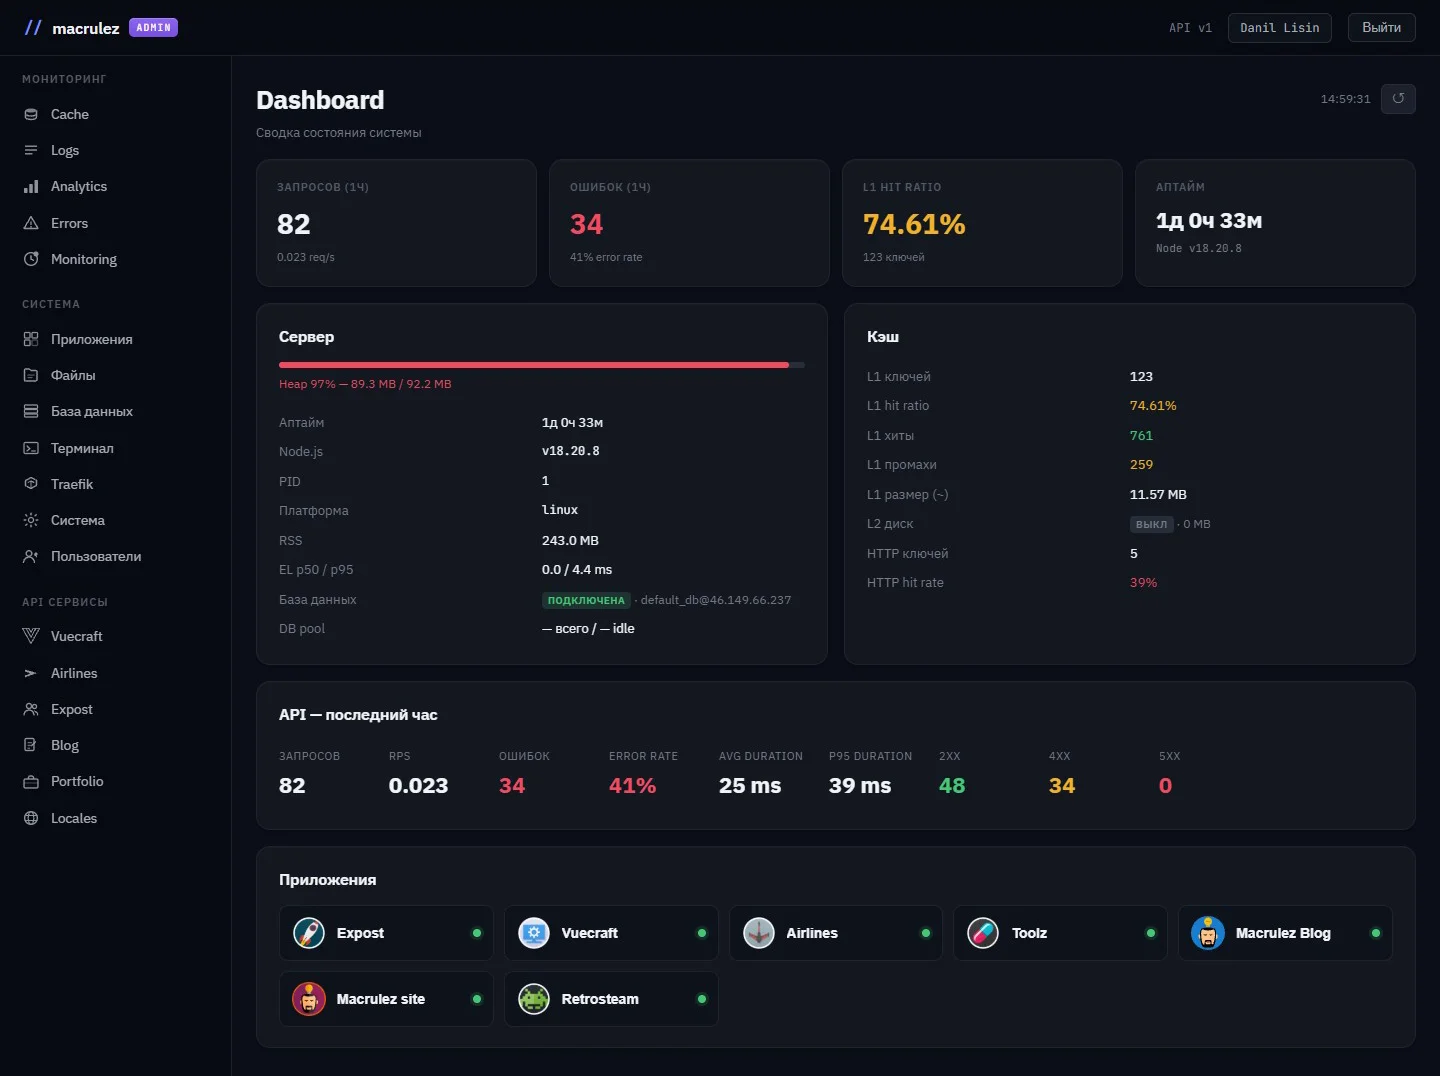
An overview screen: four stat cards (requests, errors, cache, uptime), a heap progress bar, event loop p50/p95, the connection pool, and API metrics for the past hour. Answers "is everything okay" at a glance — no picking metrics or date ranges.

RPSerror ratep95 latencyheap
02

Cache

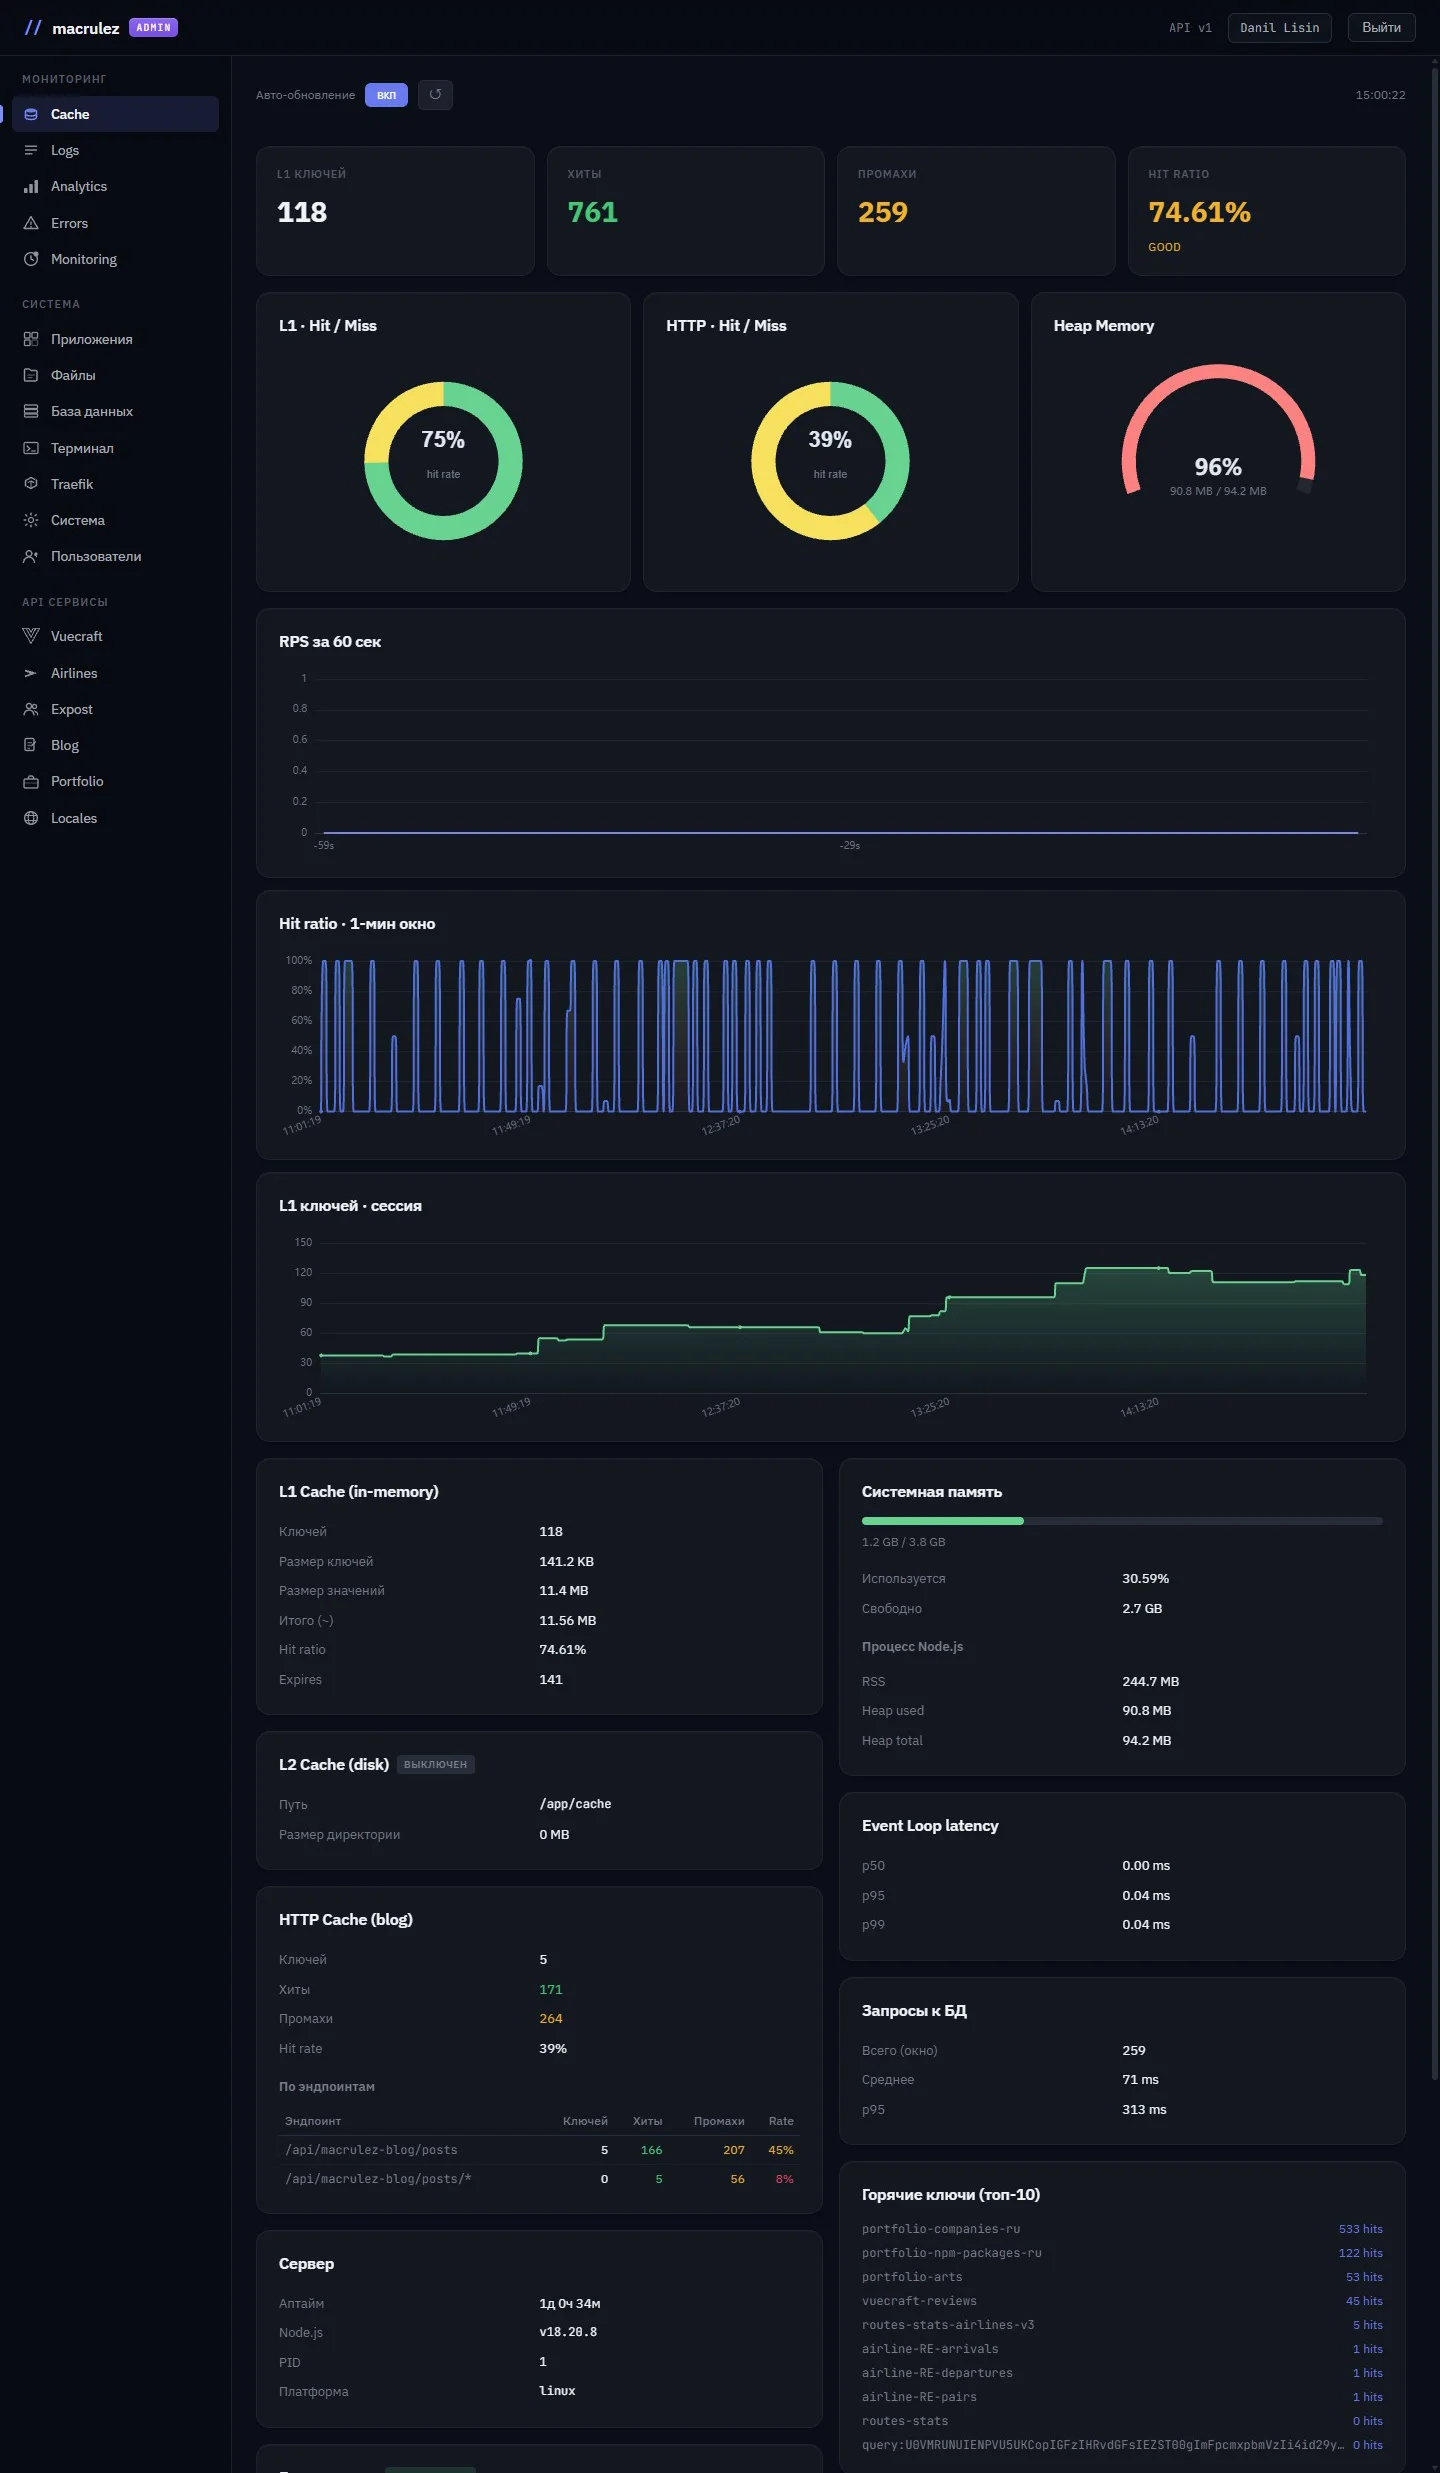
The most feature-dense section. Donut charts for L1/HTTP, a heap-memory gauge, RPS and hit-rate trends for the session. Per-endpoint stats with URL normalization. Clearing — separately for L1, L2, HTTP, or everything. A key browser with TTL, hit counts, and filtering.

NodeCachehit/missEChartswildcard clear
03–05

Logs · Analytics · Errors

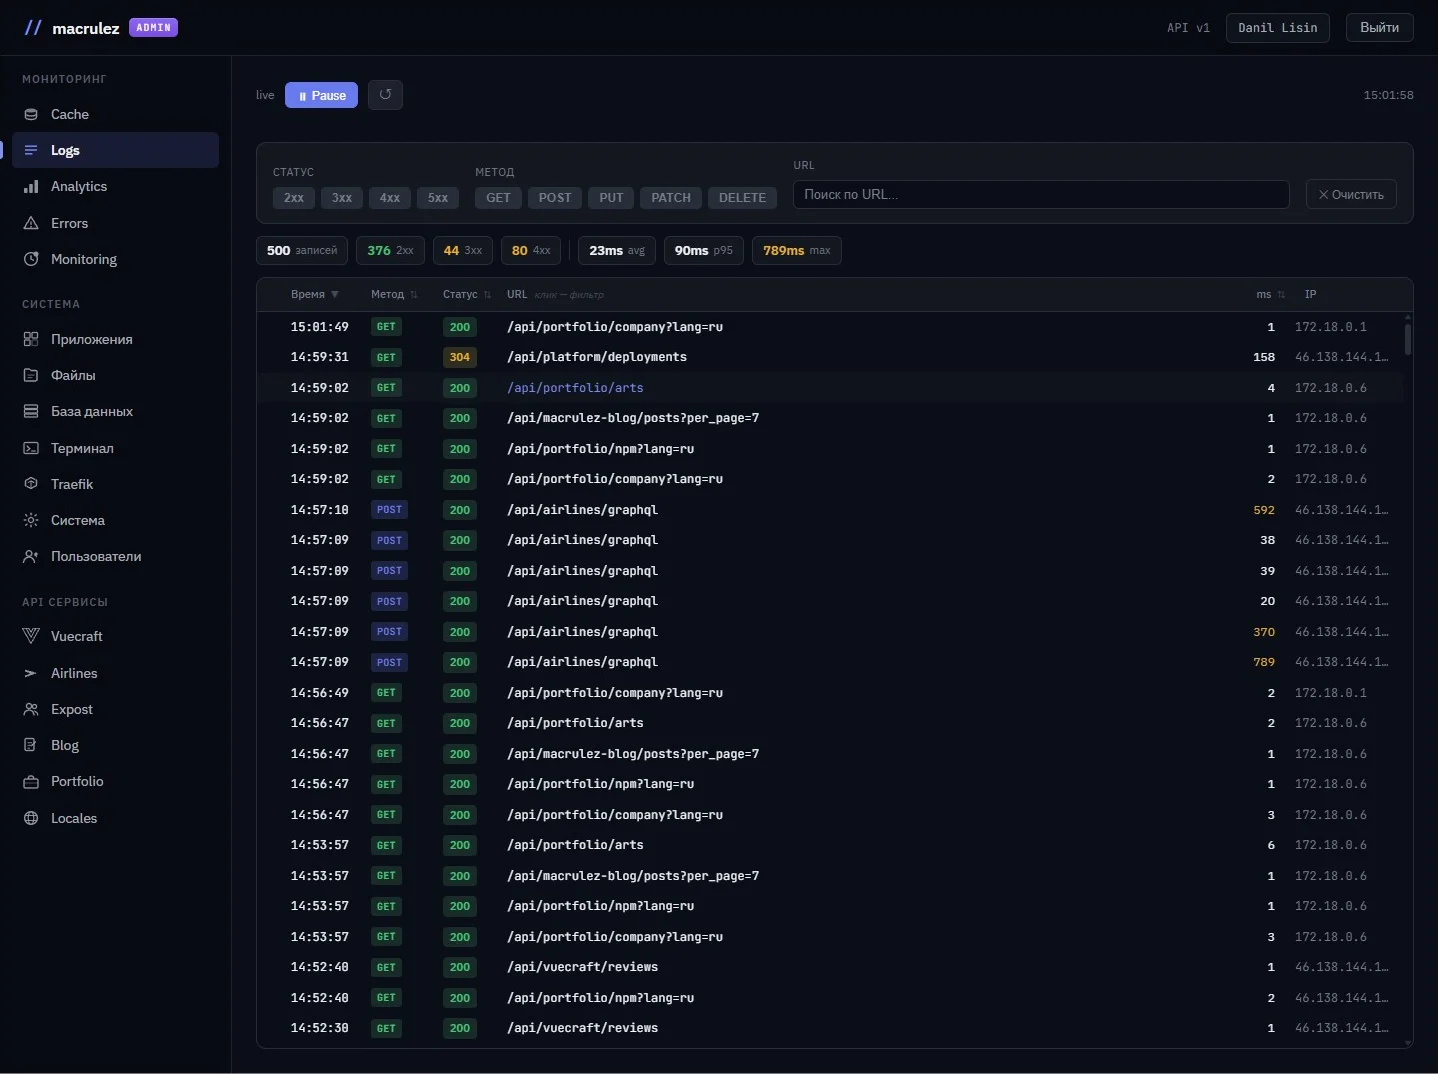
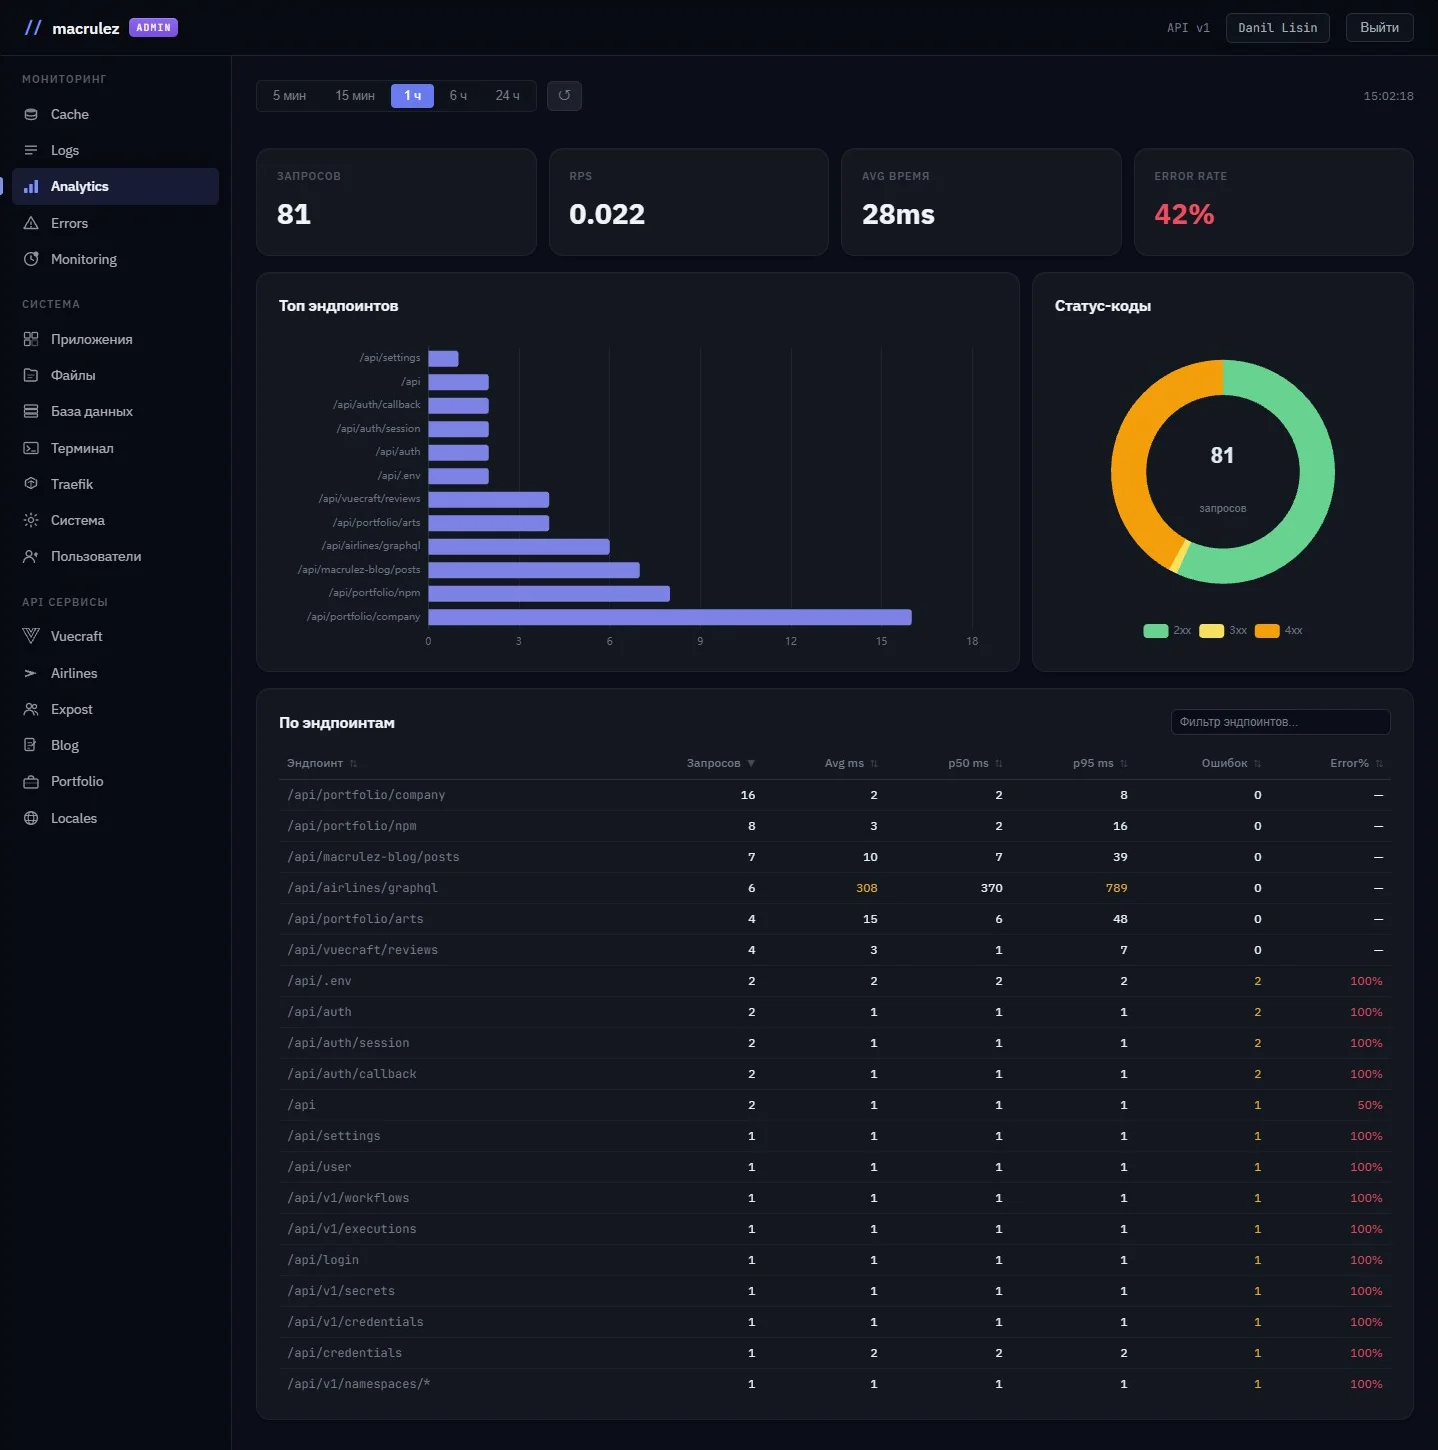
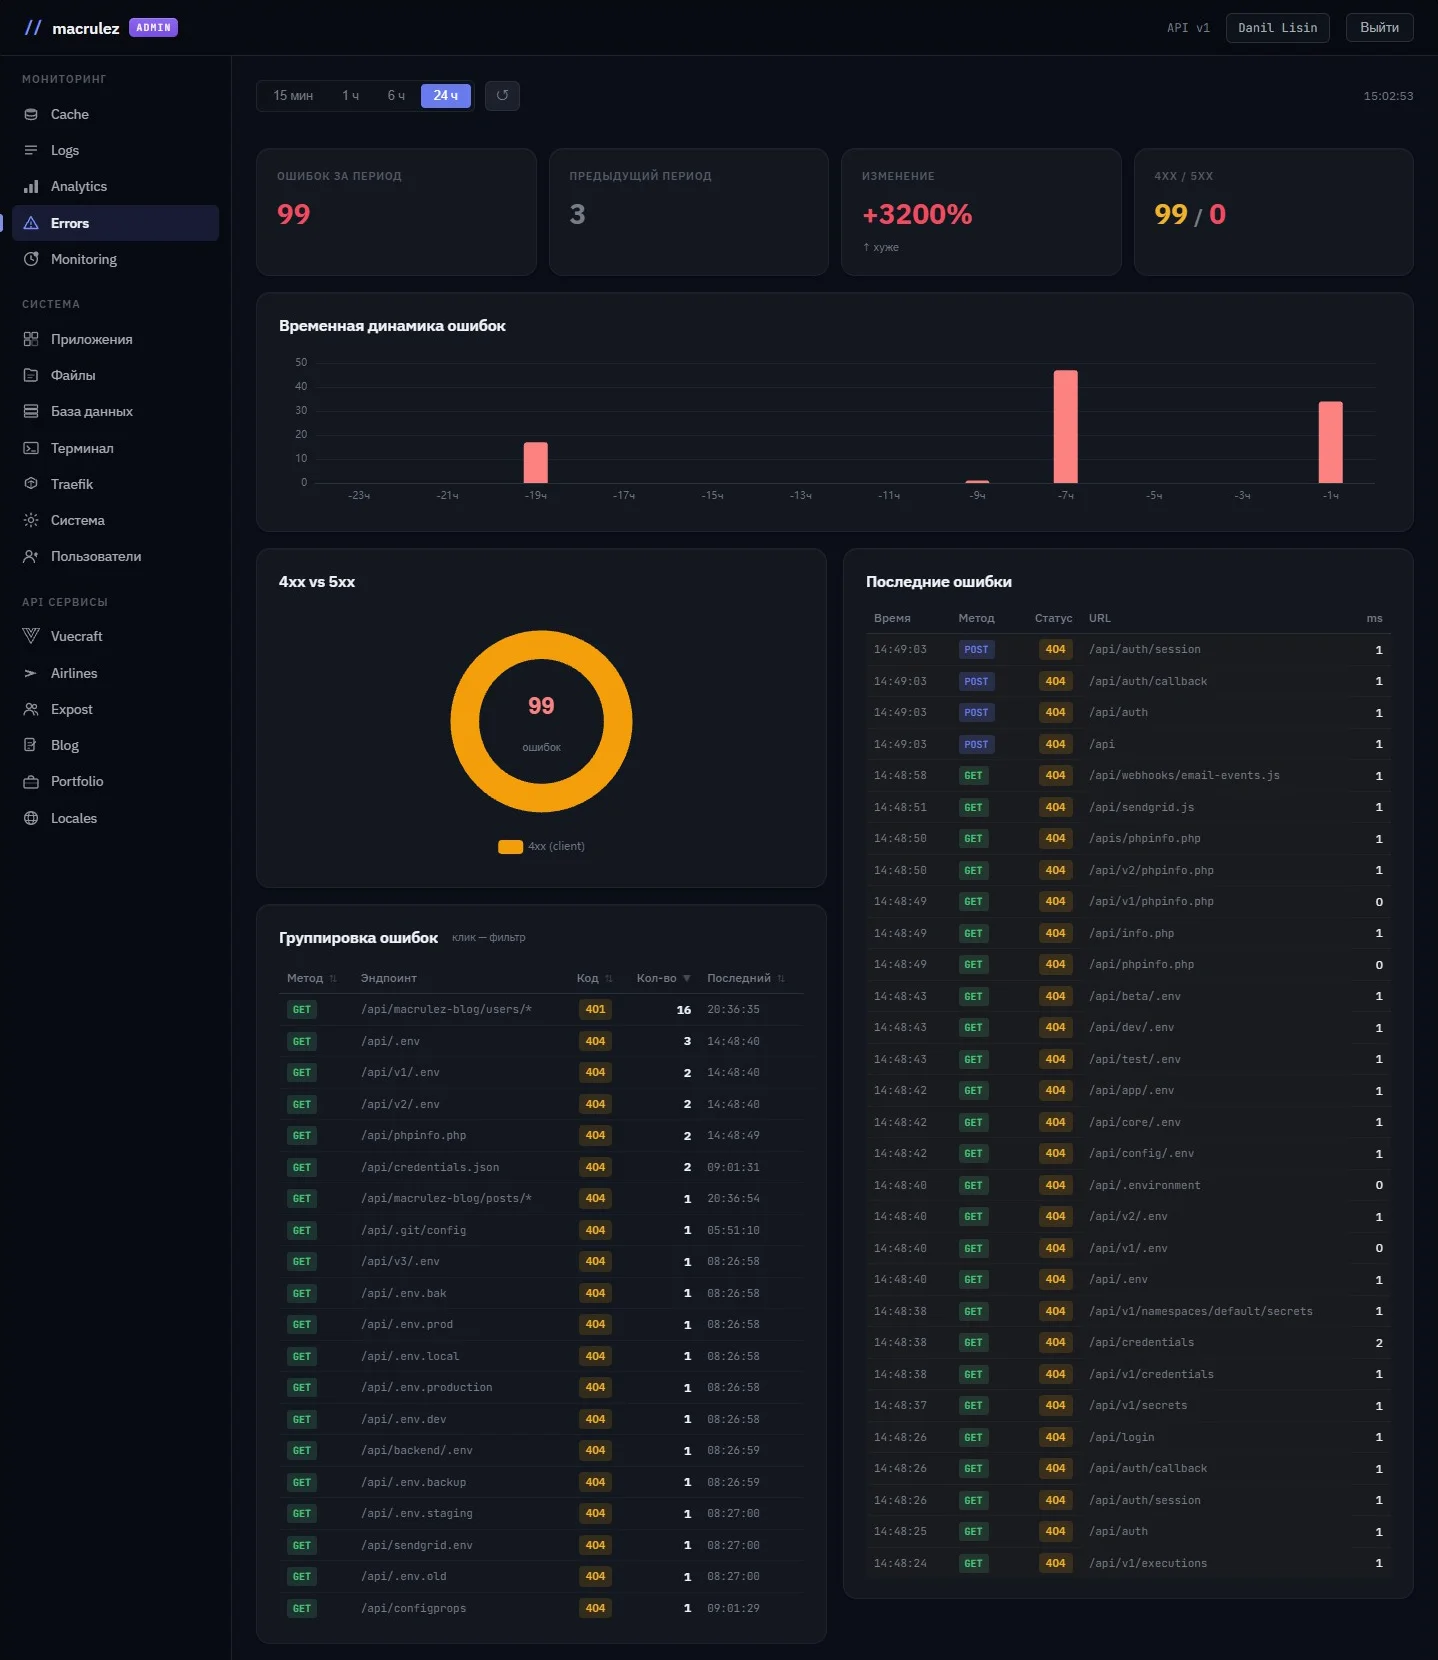
A ring buffer of 5,000 requests with persistence. Analytics for a selected period: a latency line chart, top slow endpoints, a normalized table with p50/p95. An errors section with a delta against the previous period — not "there were 42" but "+61% versus last hour."

ndjsonrolling windowp954xx/5xx grouping
06

Monitoring

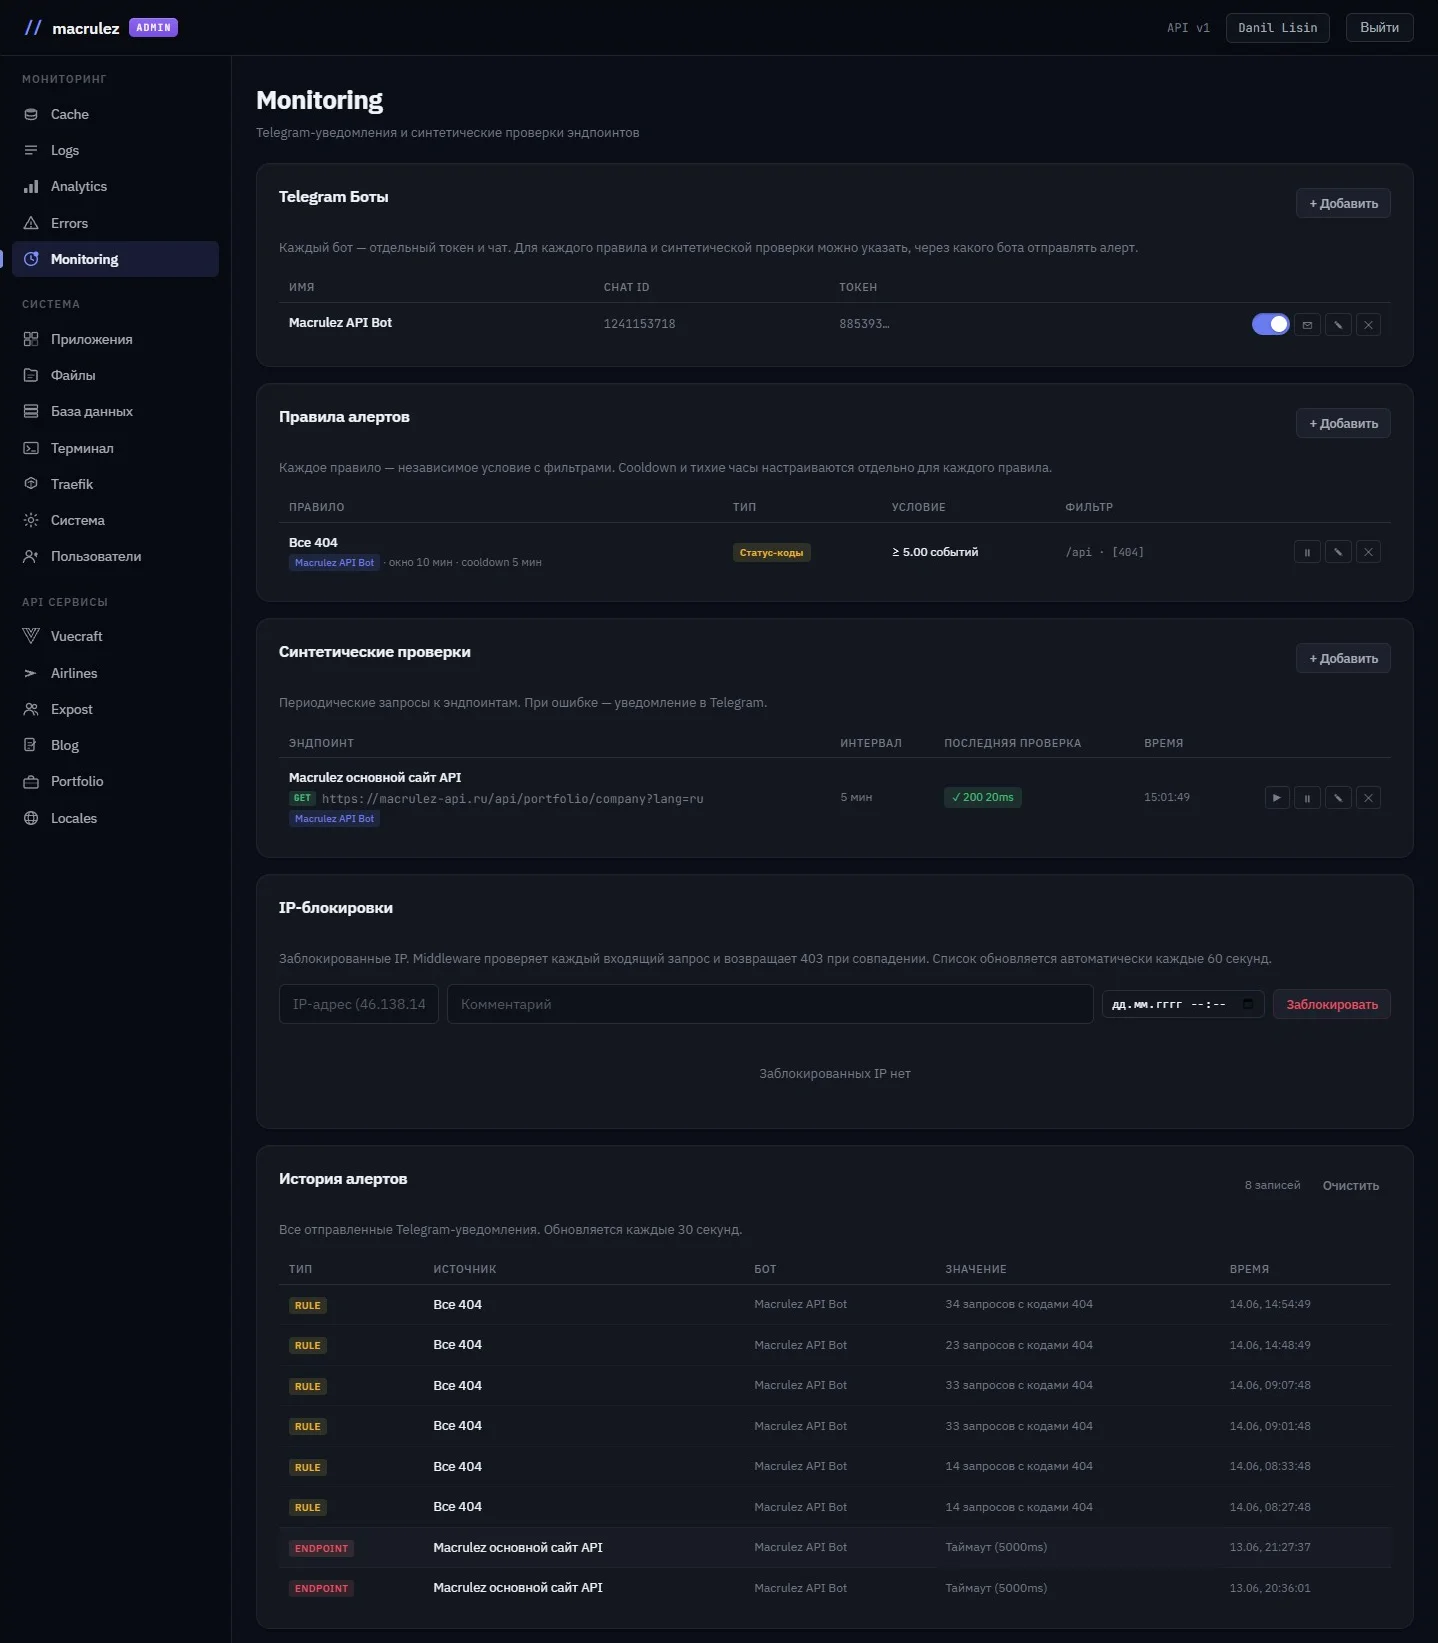
Three subsections: Telegram bots (with a test-send button right in the UI), alert rules (Error Rate / Status Codes / Slow Response — each with its own cooldown, silent hours, and bot), and synthetic checks — active scheduled pinging with a configurable failure threshold before an alert fires.

Telegramcooldownsynthetic checkssilent hours
07

API Explorer

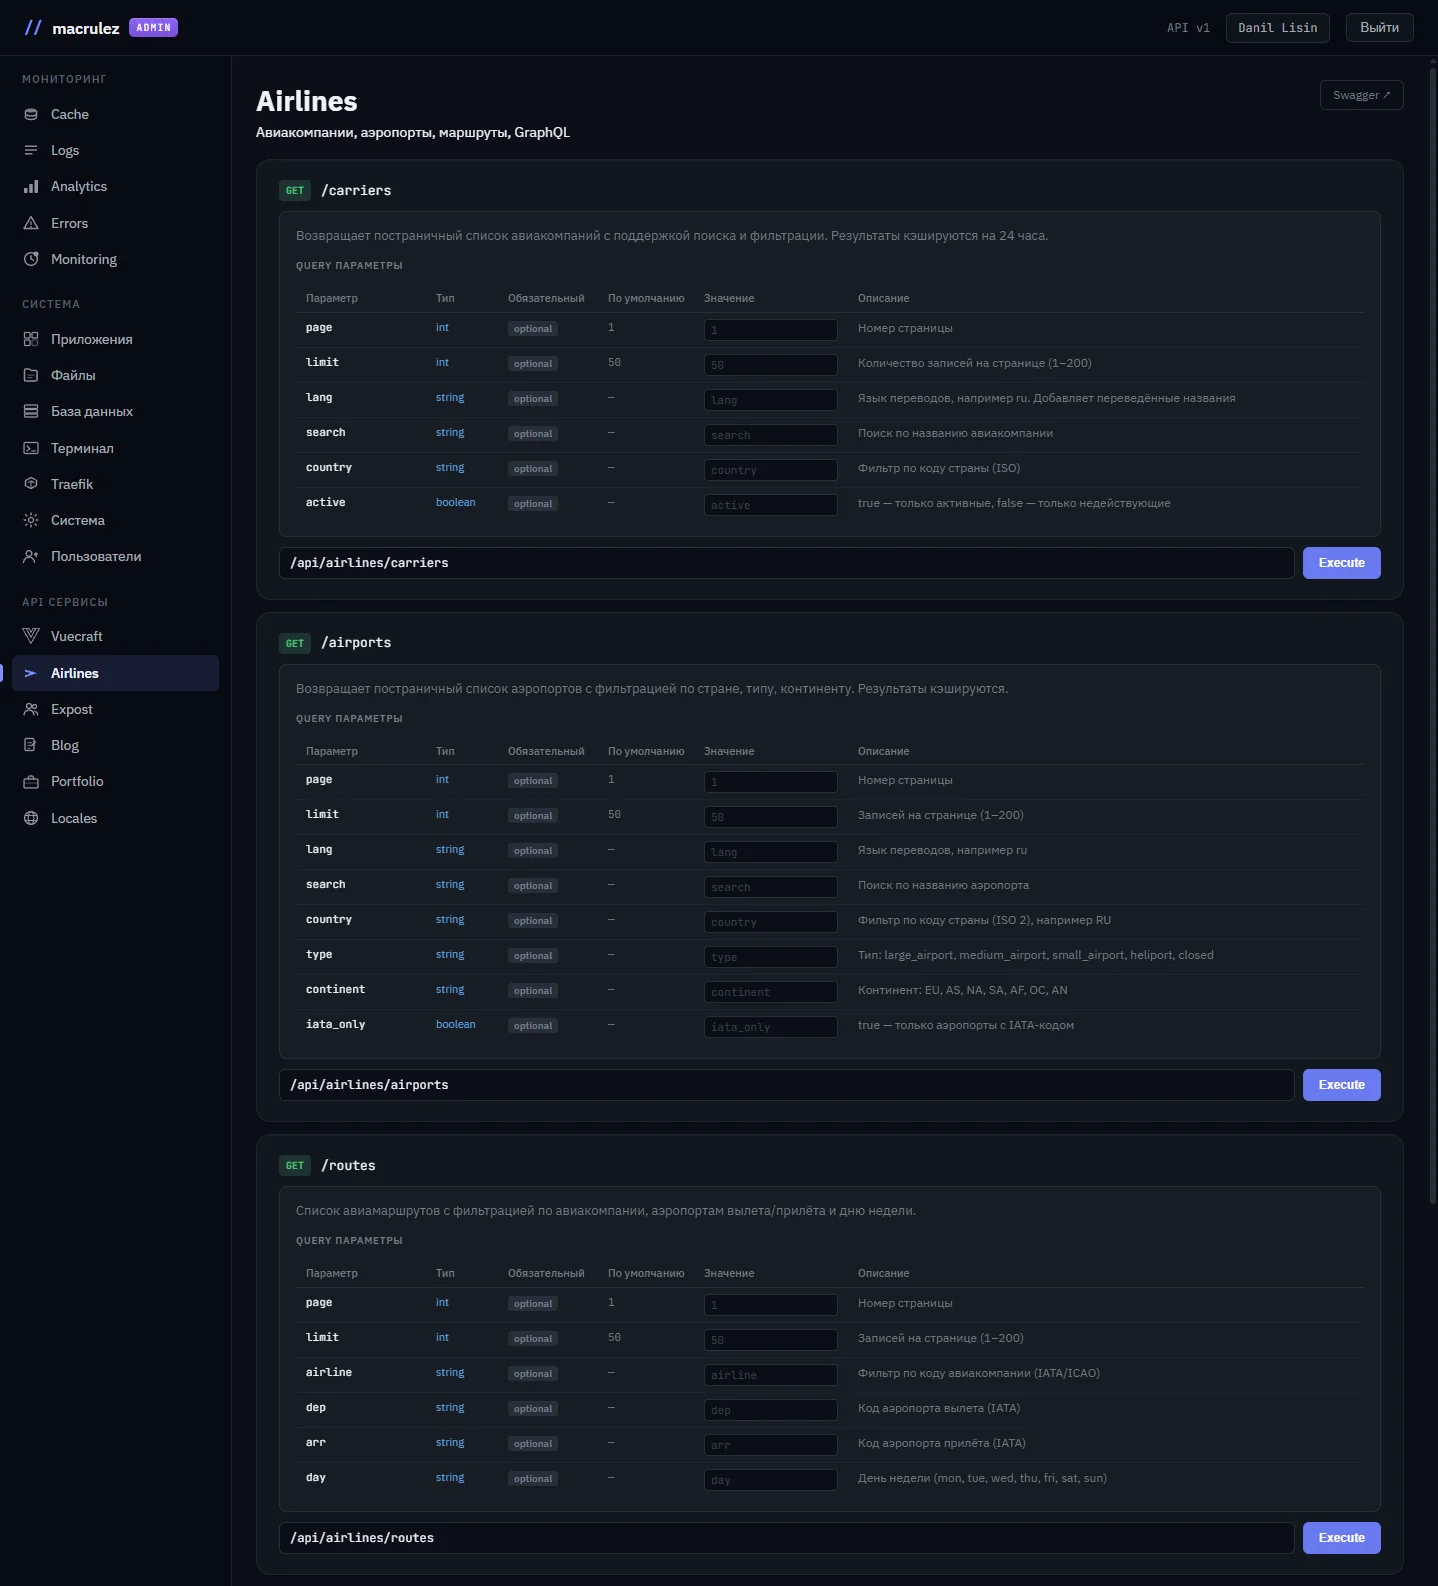
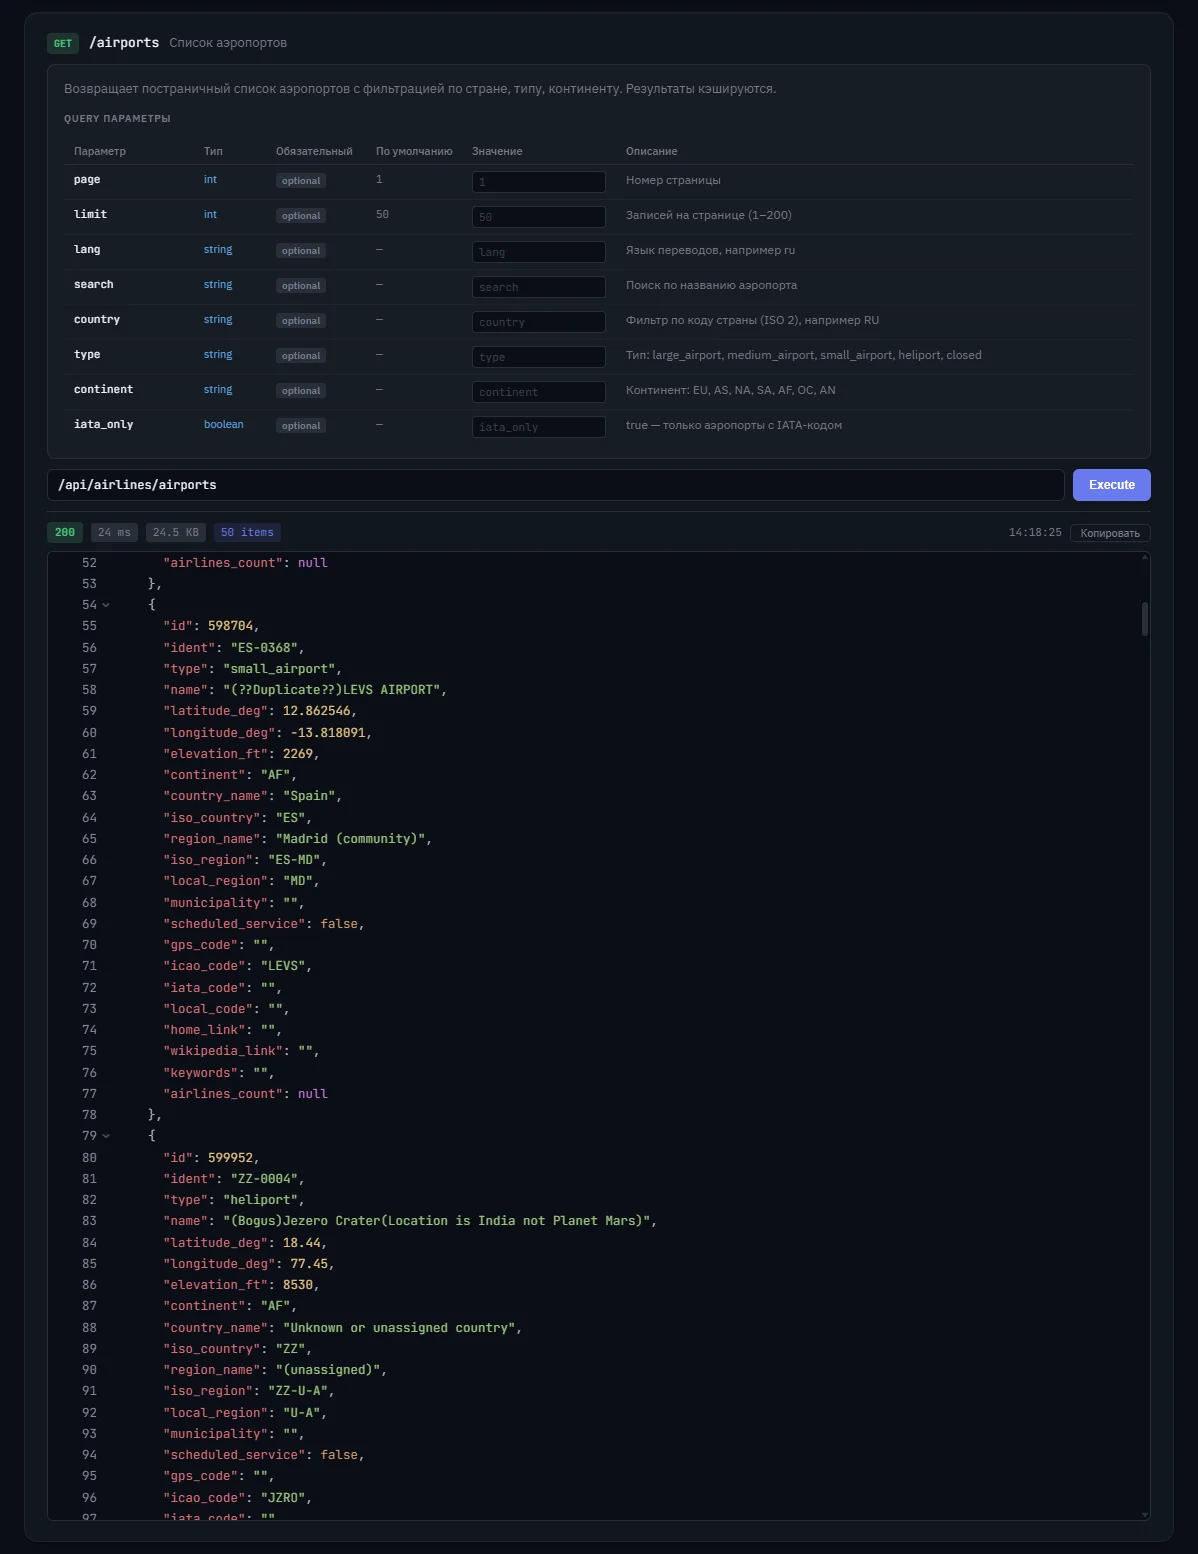
A live catalog of every endpoint: Query/Path/Body parameters with types and required flags, input fields for values that get appended straight into the URL, and an "Execute" button — status, time, size, and a syntax-highlighted JSON response. The list of services and routes lives in PostgreSQL, not in a static file.

live catalogQuery/Path/BodyExecute
The "API Services" module

Documentation,
testing, and a catalog
on one screen.

Every service comes with parameter documentation and request testing right inside the panel: no Postman, no stale collections, and no digging through source code to find a parameter's name.

  1. 01
    Documentation without leaving the test

    Under every method — up to three tables: Query, Path, and Body. Name, type, default value, a "required" or "optional" badge, and a description. If there are no parameters — an italicized "No parameters required" hint instead of an empty table.

    Query/Path/Bodyrequired/optional
  2. 02
    A value field right in the table

    Query parameters have a fifth column — an input field. Type in a value and it immediately lands in the request line below, with no manual URL editing. An "x" next to it removes the parameter from both the table and the URL in one click.

    inline inputauto URL sync
  3. 03
    Execute with the full picture of the response

    Status code, execution time, response size, and array item count — all in the response block's header. JSON is rendered with the same code editor used in the file manager: syntax highlighting for keys, strings, numbers, and null, with no separate library.

    status · time · sizecode-editor reuse
  4. 04
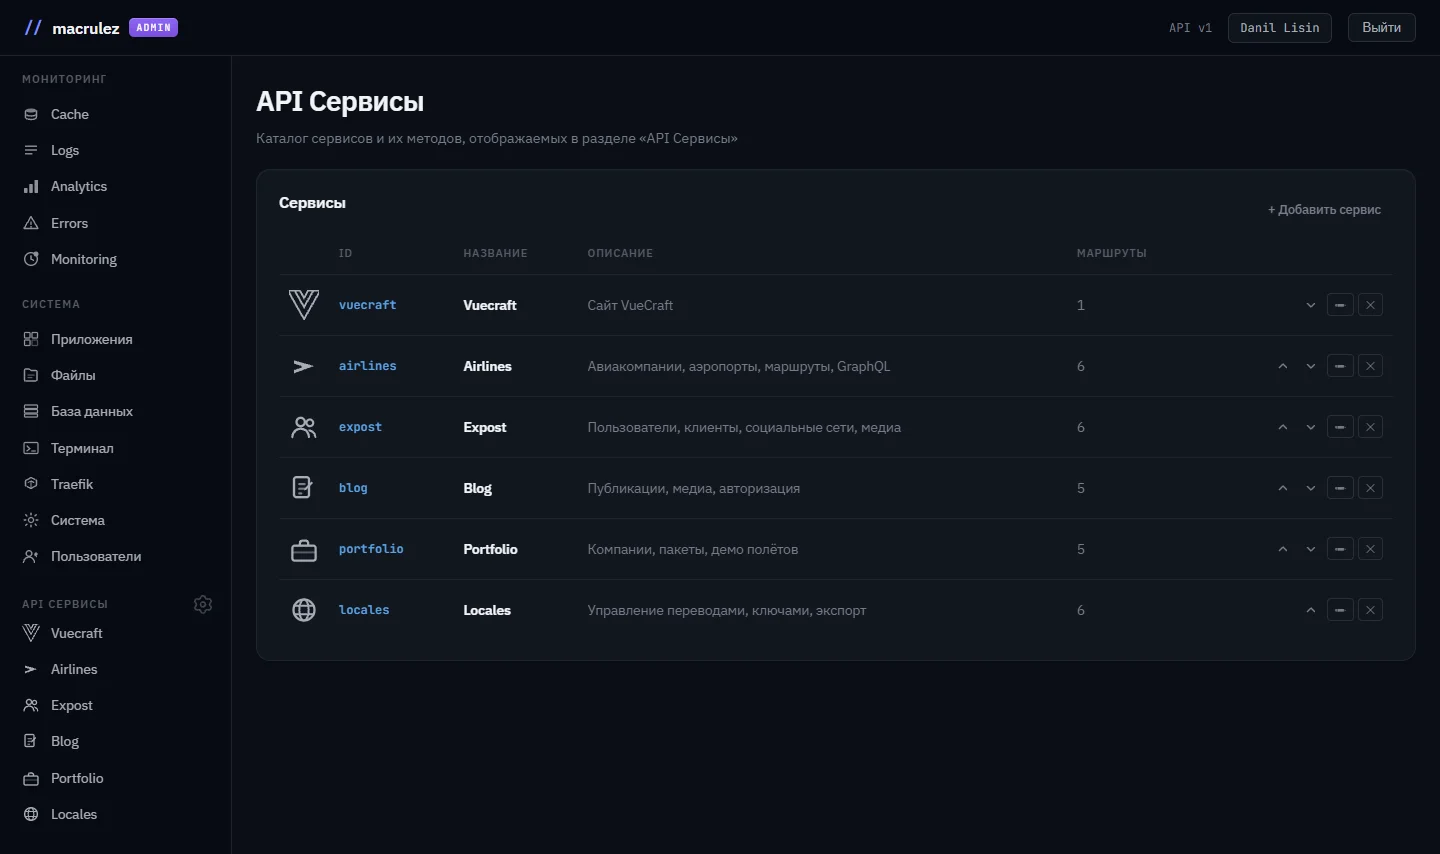
    A catalog in the database, not in code

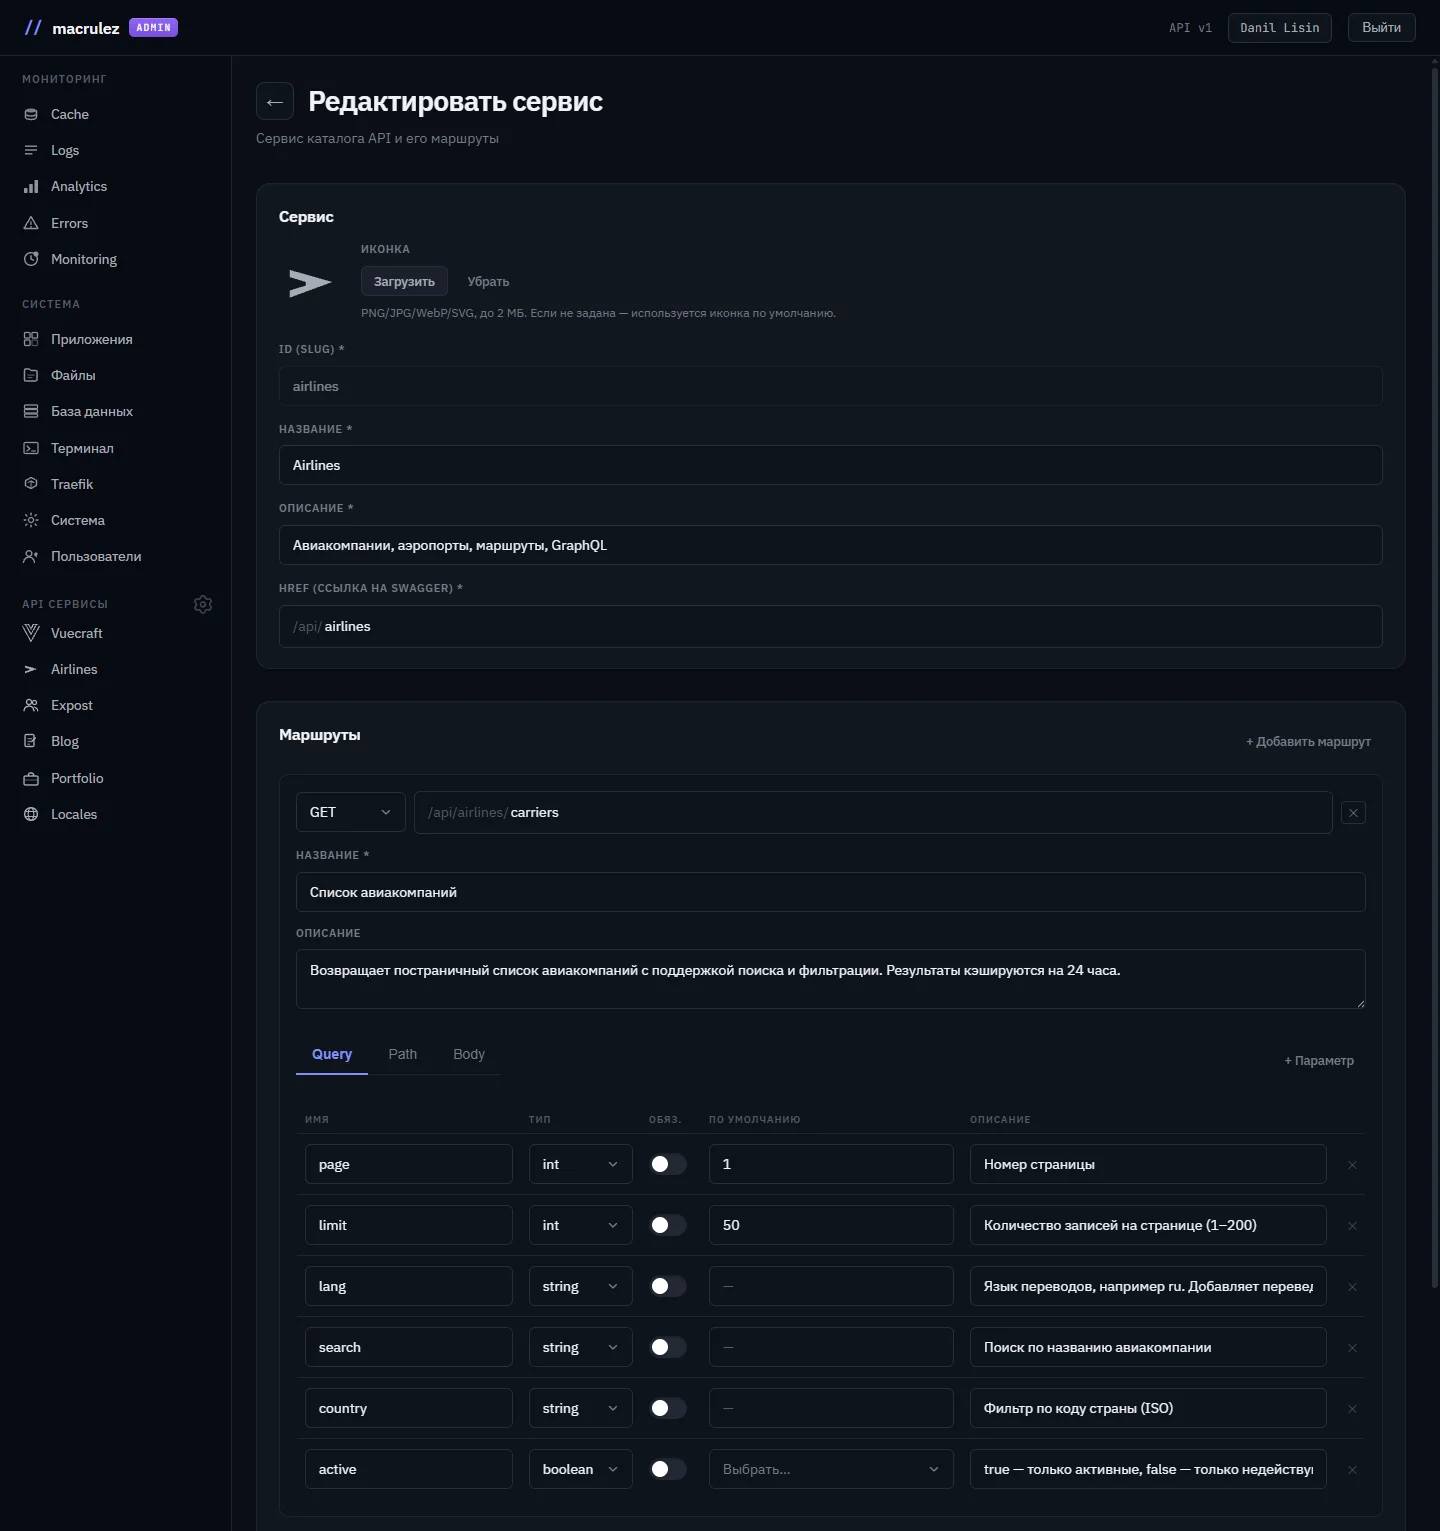
    The list of services and methods lives in two PostgreSQL tables linked by a foreign key with cascading delete — remove a service and its routes disappear on their own. A new endpoint is added through a form, with no code changes and no frontend rebuild.

    PostgreSQLFK cascadeno rebuild
  5. 05
    Parameters without a migration for every case

    Query/path/body documentation is stored in a single JSON field per route rather than a fixed-schema table. The editor form expands it into three tables with typed values, and the testing page turns it back into a real request.

    JSON fieldno new tables
Under the hood

Technical
decisions.

The trickiest parts here aren't "I plugged in a library" — they're "here's why it had to be done this way."

  1. 01
    ECharts with tree-shaking and manualChunks

    Out of the box, ECharts weighs about 800 KB — too much for a single page. I import only the components I need via echarts/core, and add manualChunks: {'{'} echarts: ['echarts', 'vue-echarts'] {'}'} in Vite. The result: the app's main JS bundle is 54 KB, and ECharts ships as a separate 627 KB chunk (217 KB gzipped) that loads once and gets cached by the browser. On every other page, ECharts doesn't load at all.

    tree-shakingcode splitting54 KB main
  2. 02
    Hit rate: a rolling window instead of a cumulative one

    A cumulative hit rate (total hits / all requests since startup) quickly loses meaning — it's too inert. Cleared the cache, or hit a burst of new requests? The cumulative number barely reacts. I use last1m.hitRate — the percentage over the last minute from a rolling buffer. On the line chart I added visualMap: the line smoothly shifts color from red to green depending on the Y value — the problem is visible immediately, no need to stare at numbers.

    rolling windowECharts visualMapreactive color
  3. 03
    Alerts: three condition types, per-rule cooldown, silent hours

    One global error-rate threshold doesn't work in reality: /api/search has a normal error rate of 8% (users search for things that don't exist), while 1% on /api/payments is already a problem. I built independent rules with URL and method filters. Cooldown lives on each rule separately — without it, a single incident generates 60 identical messages an hour. Silent hours handle the midnight rollover correctly. Everything is stored in PostgreSQL and read on every tick — a new rule starts working within a minute, with no restart needed.

    per-rule cooldownURL filtersilent hours
  4. 04
    Synthetic checks: "failures before alert"

    Alert rules are reactive: they watch traffic that has already arrived. If an external service goes down overnight with no users around, there will be no alerts. Synthetic checks actively ping URLs on a schedule, all through a single 60-second setInterval. The "failures before alert" parameter eliminates false positives from ephemeral network errors: an alert only fires if N checks in a row have failed. A single success resets the counter. An optional body-string check catches cases where a service returns 200 with a body like "status: maintenance."

    active pingingN failures thresholdbody match
  5. 05
    ctid for editing rows without a primary key

    Deleting and updating rows in the database browser works through PostgreSQL's system column ctid — the row's physical address. The backend appends ctid::text as __ctid to every SELECT and uses it in WHERE ctid = ?::tid. This works for any table regardless of whether it has a primary key — including views and legacy tables without an id.

    ctidPostgreSQL internalsno PK
In action

5 minutes
from symptom
to root cause.

I open the panel in the morning — the dashboard shows a 4.2% error rate, yellow. RPS is normal, no deploys since last night. I go to "Errors": delta +61% versus the previous hour, all 5xx. The timeline shows a spike starting at 7:40.

The grouping table has one dominant row: GET /api/airlines/* 503, 38 occurrences in the past hour. I go to "Analytics," a 6-hour window, filtered to /api/airlines, sorted by p95 — /api/airlines/graphql has a p95 of 1840 ms, everything else is under 200 ms. Problem localized.

"Logs," filtered to GET, 5xx, /api/airlines — every error has the same body: a database timeout. Dashboard: connection pool — 10 total, 0 idle, pool exhausted. "API Explorer," a database-stats query straight from the browser — one query has been hanging for 12 minutes already. From here on, it's a code problem.

The old way was the same story: docker logs

Screenshots

What it
looks like.

"Good observability isn't when you watch the monitoring — it's when the monitoring watches the system for you, and only shows up when it's actually needed."

— from building Macrulez App Container
Next step

Need observability or admin tooling?

I'll design and build everything from the dashboard to the data browser. I work with Node.js, Vue 3, and PostgreSQL.